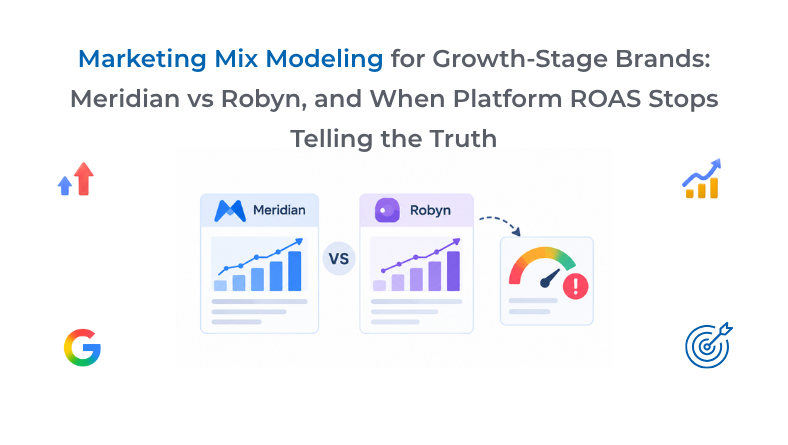
Your Meta dashboard says 4x ROAS. Your bank statement says something else entirely. That gap is exactly what marketing mix modeling exists to close, and for growth-stage brands spending real money across channels, ignoring it is now an expensive habit, not a minor oversight. At PROHED, a performance marketing agency working with D2C and ecommerce brands, we’ve watched blended revenue and platform-reported revenue drift further apart every year, mostly because every platform is incentivized to take credit for the same sale.
Why Platform ROAS Stops Telling the Truth
Meta counts a conversion if someone saw an ad and bought within a wide attribution window, even if they’d have bought anyway. Google does something similar. Run the same numbers across Meta, Google, and your affiliate network, and the sum of “attributed revenue” regularly exceeds total company revenue. That’s not a tracking bug. It’s how last-touch and multi-touch attribution are built to work, each platform claiming partial or full credit for outcomes it merely touched.
A few forces have made this worse recently:
- iOS privacy changes and cookie restrictions have degraded user-level tracking across the board, so platforms increasingly model conversions rather than observe them directly.
- Blended ROAS and MER (marketing efficiency ratio, total revenue divided by total spend) give you a company-wide sanity check, but neither tells you which channel actually drove the incremental sale.
- Multi-touch attribution still relies on tracked touchpoints, which means it systematically undercounts channels like OOH, TV, and podcast ads that never leave a clickable trail.
This is where MMM vs multi-touch attribution stops being an academic debate. MTA tells you what happened inside a browser. MMM tells you what happened to sales, using statistics rather than pixels, which is exactly why it survives a cookieless world that MTA increasingly can’t.
What Marketing Mix Modeling Actually Measures
Media mix modeling uses historical data, spend, sales, pricing, promotions, seasonality, to statistically estimate how much each channel actually contributed to revenue. Instead of tracking individual users, it looks at aggregate patterns over weeks or months and works backward to isolate each channel’s real effect.
The output most growth teams care about is marginal ROI: not “what did this channel return on average,” but “what would the next rupee spent on this channel return.” That distinction changes budget decisions completely. A channel with strong average ROAS can have terrible marginal ROI if you’re already spending near its saturation point.
Google Meridian vs Meta Robyn: The Real Differences
Both are free, open-source, and genuinely used in production by serious marketing teams. The choice between them comes down to your data maturity and team, not which logo you prefer.
| Factor | Google Meridian | Meta Robyn |
|---|---|---|
| Statistical approach | Bayesian regression, with stated uncertainty ranges | Ridge regression plus evolutionary algorithm tuning |
| Best suited for | Teams with real data science capacity and a Google-heavy media mix | Roughly 80% of organisations, especially paid-social-heavy brands |
| Setup time | Weeks to a full quarter for a proper build | Typically a few weeks |
| Ecosystem fit | Integrates naturally with GA4, Google Ads, YouTube | Neutral across platforms, no Meta-specific bias in output |
| Geo-level modelling | Supports hierarchical geo modelling out of the box | Requires more manual setup for geo-level analysis |
| Accessibility | Google added a no-code Scenario Planner in early 2026 to ease this | Semi-automated workflow, faster to get a first read |
If your team doesn’t have a data scientist on staff, Robyn is generally the more forgiving starting point. Meridian rewards teams willing to invest in a proper build, particularly if a large share of spend already sits inside Google’s ecosystem.
Geo Holdout Tests: The Simplest Way to Check If a Channel Actually Works
Before committing to a full MMM build, a geo holdout test gives you a faster, cruder answer. Split comparable markets or regions into a test group (running the channel) and a control group (not running it), then compare sales lift between them.
This is genuinely a form of incrementality testing and causal lift measurement, and it doesn’t require a statistician to interpret. If a channel shows negligible lift in the test region compared to the holdout, that’s a strong signal the platform’s reported ROAS is largely capturing demand that existed anyway.
Building a Practical MMM Workflow for a Growth-Stage Brand
You don’t need enterprise data infrastructure to start. A realistic sequence:
- Centralise your data first: Weekly spend by channel, weekly revenue, pricing changes, promotions, and any major external events (festivals, competitor launches) all need to sit in one clean dataset before any model means anything.
- Run a geo holdout test in parallel, on at least one channel you’re unsure about, while the MMM build is underway. This gives you a rough sanity check against the eventual model output.
- Pick Robyn if you’re testing this for the first time: Faster setup, lower data science overhead, and genuinely solid for most digital-first brands.
- Validate against known truths: If your MMM says paid search drove near-zero incremental revenue during a month you know it mattered, something’s wrong with the model, not necessarily the channel.
- Re-run quarterly, not annually: Media mix, pricing, and competitive dynamics shift fast enough that a stale model quietly becomes a wrong one.
Rebuilding Budget Allocation Around Marginal ROI
Most budget allocation decisions still get made on average ROAS, which consistently overfunds channels that are already saturated and underfunds ones with real remaining headroom. An MMM output reframes this conversation entirely: instead of “which channel performed best last month,” the question becomes “where does the next rupee actually go furthest.”
In practice, this often means pulling some budget away from a channel showing strong platform-reported ROAS but flat marginal returns, and testing it in a channel the platforms structurally undercount, like offline or upper-funnel formats that never show up cleanly in last-click reporting.
How PROHED Approaches Blended Measurement
We build blended ROAS and MER tracking into every performance marketing engagement from the start, precisely because platform-reported numbers alone tend to justify decisions that don’t hold up once you look at total revenue. For growth-stage D2C and ecommerce clients specifically, that usually means running incrementality checks alongside standard campaign optimisation across Google Ads and Meta Ads, rather than trusting in-platform attribution at face value.
As digital marketing agencies in Gurugram go, we’ve found the brands that make the fastest progress here are the ones willing to run a small geo holdout test even before committing to a full MMM build, since it’s a genuinely fast way to validate or challenge what the dashboards are claiming.
Conclusion
Platform ROAS was never designed to answer the question growth-stage brands actually need answered: which spend is truly incremental. Marketing mix modeling, whether through Meridian, Robyn, or a simpler geo holdout test to start, gives you a statistically grounded answer that survives cookie deprecation and platform bias. Start small, validate against what you already know to be true, and treat marginal ROI, not average ROAS, as the number that actually drives your next budget decision.
FAQs
1. What is marketing mix modeling used for?
Marketing mix modeling estimates how much each marketing channel actually contributed to sales, using historical spend and revenue data rather than user-level tracking. It’s particularly useful for measuring channels that don’t generate clickable, trackable touchpoints, like TV, OOH, or podcast advertising.
2. Is Google Meridian better than Meta Robyn?
Neither is universally better; the right choice depends on your team’s data science capacity and media mix. Meridian suits teams with real statistical expertise and a Google-heavy spend, while Robyn tends to work well for the majority of digital-first, paid-social-heavy brands looking for a faster first read.
3. What’s the difference between MMM and multi-touch attribution?
MTA tracks individual user touchpoints and works well until cookies or tracking break down, which is happening more often. MMM uses aggregate statistical patterns instead, so it keeps working in a cookieless environment and can measure offline channels MTA simply can’t see.
4. What is a geo holdout test?
It’s a simpler incrementality test where you run a channel in some markets and deliberately withhold it in comparable others, then compare the sales difference. It’s a faster, less resource-intensive way to check whether a channel is genuinely driving incremental sales before investing in a full MMM build.
5. Why does blended ROAS differ so much from platform-reported ROAS?
Each platform tends to claim credit for conversions it merely influenced rather than caused, which inflates individual channel numbers when added together. Blended ROAS, calculated from total company revenue against total spend, strips out that double-counting and gives a more honest efficiency picture.
6. How often should a brand rebuild its MMM?
Quarterly rebuilds are generally recommended over annual ones, since media mix, pricing, and competitive activity shift quickly enough to make an old model misleading. A model that’s a year old can confidently point you toward decisions that no longer match current market reality.
7. Do small or growth-stage brands really need MMM, or is it just for large enterprises?
Open-source tools like Meridian and Robyn have genuinely made MMM accessible beyond large enterprises with dedicated data science teams. A growth-stage brand spending meaningfully across three or more channels usually has enough data to get directionally useful results, even without a perfect enterprise-grade build.
8. What is marginal ROI, and why does it matter more than average ROAS?
Marginal ROI measures what the next unit of spend on a channel would return, rather than the average return across all spend so far. A channel can show excellent average ROAS while offering almost nothing on the next rupee spent, which is exactly the distinction that should guide budget allocation decisions.
Want help figuring out whether your platform ROAS numbers actually reflect incremental revenue? Talk to PROHED, a marketing agency in Gurgaon that builds blended measurement into performance marketing from day one.
Schedule a Free Strategy Call with PROHED Today