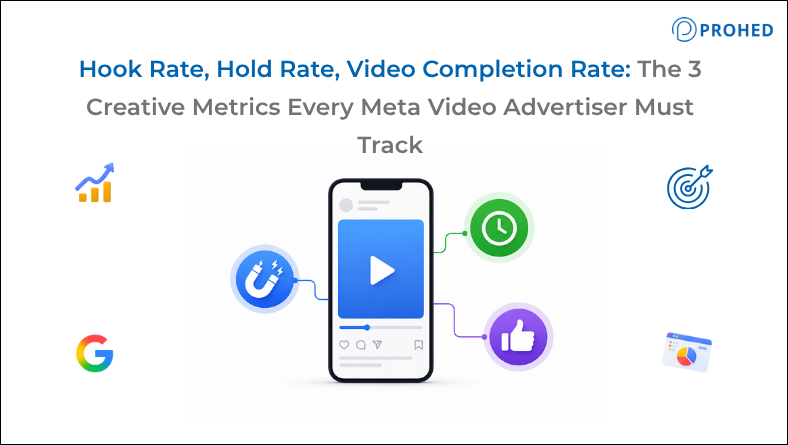
Creative metrics are the performance signals that reveal how a video ad is being experienced at each stage of the attention journey, before anyone has clicked or converted. Hook rate tells you whether viewers stayed past the first three seconds. Hold rate tells you whether the middle of the video earned continued attention. Video completion rate tells you whether the creative delivered enough value for someone to watch it all the way through. At Prohed, a performance marketing agency in Gurgaon, we use these three metrics as a diagnostic layer across every video ad campaign we run, because ROAS and CTR alone never tell you where a video is actually losing the audience.
Most advertisers running Meta ads campaigns are testing the right things in the wrong order.
The creative gets built. It goes live. CTR comes in low. The headline gets changed. CPA climbs. The audience gets narrowed. ROAS drops. The budget gets cut.
Every one of those decisions was made without answering a more fundamental question: did anyone actually watch the video long enough for the message to land?
This is the diagnostic gap that creative metrics for video advertising fill. And it’s the gap that separates advertisers who fix the right problem from those who keep adjusting the wrong lever.
If you haven’t read our guide on how to build a creative testing framework for Meta, start there first. This article sits one layer deeper: it covers how to diagnose creative performance once your tests are running, using three specific video metrics that most accounts aren’t tracking yet.
Why CTR Is the Wrong Starting Point for Video Diagnosis
Here’s the issue with reading a video ad campaign through CTR first.
A click happens at the end of the attention journey, not the beginning. For someone to click, they first had to stop scrolling, watch enough of the video to understand the offer, and decide it was worth acting on.
If CTR is low, the problem could be in any one of those stages. The issue might lie in a weak opening frame, a mid-video drop-off before the offer appeared, or an unclear CTA. Or it could genuinely be that the offer isn’t compelling enough.
CTR tells you that something failed. It doesn’t tell you which stage failed first.
Creative metrics for video advertising solve this by giving you a clear signal at each stage of the attention chain. When you read them in sequence, the diagnostic becomes precise rather than directional.
The Prohed Video Creative Diagnostic Stack
At PROHED, we evaluate video campaign performance using three metrics in a specific sequence before making any creative decision. We call this the Prohed Video Creative Diagnostic Stack.
The principle is simple: always fix the earliest stage of the attention chain first. Improving a CTA doesn’t matter if the video is being skipped at the three-second mark. Improving the hook doesn’t matter if the hold rate is collapsing because the middle section is weak.
Metric 1: Hook Rate
What it measures: The percentage of impressions where a viewer stayed through the first three seconds.
Formula: 3-second video views ÷ Impressions × 100
Benchmarks for Meta:
|
Hook Rate |
What It Signals |
|
Below 15% |
Opening isn’t creating a reason to stay |
|
15% to 24% |
Hook needs work before diagnosing anything downstream |
|
25% to 30% |
A solid working baseline for most accounts |
|
30% to 39% |
Strong early interest, message has room to land |
|
40%+ |
Excellent — validate with hold rate before scaling |
Hook rate is the first diagnostic checkpoint. If it’s below 25%, the opening three seconds are failing before any offer, proof, or CTA has had the chance to appear.
The most consistent fix isn’t a catchier headline. It’s removing everything in the first three seconds that doesn’t immediately signal who the video is for or what problem it addresses.
Cold audiences respond to pattern interrupts: a sharp visual contrast, a direct audience callout on screen, an unexpected first frame, or a spoken line that states the problem before any setup. Warm audiences respond to proof and specificity. Both need the first three seconds to earn continued attention fast.
Additionally, hook rate should always be segmented by placement. The same video often performs differently in Instagram Reels versus Facebook Feed versus Stories because user scroll behaviour and viewing context differ meaningfully between surfaces. A blended hook rate across all placements masks that difference.
Metric 2: Hold Rate
What it measures: Of the viewers who stayed through the hook, how many continued watching past 15 seconds.
Formula: 15-second video views ÷ 3-second video views × 100
Benchmarks for Meta:
|
Hold Rate |
What It Signals |
|
Below 25% |
Video drops off sharply after the hook |
|
25% to 35% |
Middle section needs tighter pacing or stronger proof |
|
35% to 50% |
Strong hold — message is landing after the hook |
|
50%+ |
Excellent — viewer is genuinely engaged with the content |
Hold rate is where most video creative analysis stops too early.
A high hook rate paired with a low hold rate is one of the most instructive combinations in video metrics reading. It means the opening earned the viewer’s initial attention, but the video failed to deliver on what it implied. The viewer stopped watching because the middle section didn’t match the energy or relevance of the first few seconds.
Common hold rate problems include:
- A visual hook that transitions to a slow talking-head format with no movement or text reinforcement
- A problem stated in the hook but not addressed quickly enough in the following seconds
- A pacing structure that builds slowly toward a benefit the viewer expected to see earlier
- Repetition of the hook’s point rather than immediately advancing the narrative
For social media ads specifically, hold rate improvement usually comes from structural changes to the body of the video rather than creative style changes. Moving proof earlier, cutting transitional filler, adding on-screen text that mirrors the spoken content, and tightening the benefit explanation to fit within the first 15 seconds all tend to improve hold rate more reliably than reshooting the video entirely.
Metric 3: Video Completion Rate
What it measures: The percentage of people who watched the full video from start to finish.
Formula: Complete video views ÷ Total video plays × 100
Benchmarks for Meta:
|
Completion Rate |
What It Signals |
|
Below 10% |
Video is losing viewers at multiple points, not just one |
|
10% to 20% |
Acceptable for longer videos (60 seconds+) |
|
20% to 35% |
Strong for mid-length videos (30 to 60 seconds) |
|
35%+ |
Excellent — video is holding attention all the way through |
Video completion rate is the metric that closes the diagnostic picture.
Hook rate and hold rate tell you about the front half of the video. Completion rate tells you whether the back half, the benefit explanation, the proof points, and the CTA, earned continued attention after the viewer was already engaged.
A high hold rate alongside a low completion rate typically means the video has a structural drop-off point somewhere in the middle to final third. Finding that point requires pulling the video’s retention curve from Meta Ads Manager’s video breakdown report, which shows exactly where viewers are leaving at each timestamp.
This timestamp data is the most specific diagnostic tool available for video advertising. It removes guesswork entirely, replacing “the video might be too long” with “viewers are leaving at the 28-second mark, which is exactly when the product explanation section starts.”
Additionally, completion rate interacts with video length in a non-linear way. A 15-second video with a 40% completion rate is performing strongly. A 90-second video with 40% completion is genuinely exceptional. Reading completion rate without knowing the video’s length, therefore, produces misleading benchmarks.
Reading All Three Together: The Diagnostic Matrix
The full value of these three creative metrics comes from reading them together. Each combination points to a specific, actionable fix.
|
Hook Rate |
Hold Rate |
Completion Rate |
What It Means and What to Fix |
|
Low |
Low |
Low |
Opening frame and first line need a full rework before anything else |
|
High |
Low |
Low |
Hook works but video drops off immediately after; fix pacing and middle section |
|
High |
High |
Low |
Video holds attention through the middle but loses viewers before the CTA; move the CTA earlier |
|
High |
High |
High |
Creative is working structurally; check CTR and CPA to assess offer and landing page |
|
High |
Low |
High |
Unusual pattern, suggests viewers are skipping through; check for autoplay behaviour |
This matrix eliminates the guesswork from creative revision decisions. Rather than changing targeting when CTR drops, the diagnostic tells you specifically which part of the video broke the attention chain first. Consequently, revisions become faster, cheaper, and far more likely to move the actual needle.
How to Set These Up in Meta Ads Manager
None of these metrics appear as default columns. All three need to be created as custom metrics.
Go to Ads Manager, select Columns, choose Customize Columns, then select Create Custom Metric. Build each one using the formulas above and save them as a custom column view named “Video Creative Diagnostics” or similar.
Review these metrics at the individual ad level, not the ad set or campaign level. Ad sets frequently contain multiple creatives with very different performance profiles, and a blended average across them hides the performance gap between individual videos entirely.
For facebook marketing strategy that includes both video and static formats, keep these metrics in a separate custom view from standard performance columns. Video creative metrics and conversion metrics answer different questions, and mixing them in the same view tends to produce muddled analysis.
Where These Metrics Connect to Campaign Performance
Creative metrics for video advertising are diagnostic tools, not success metrics.
A 40% hook rate with a 20% hold rate and a 5% completion rate, followed by a CPA that’s three times the target, is not a creative success story. It’s a video that’s generating curiosity without commercial intent.
Conversely, a 22% hook rate with strong hold, high completion, a healthy CTR, and an on-target CPA is a video worth scaling, even though the hook benchmark looks merely average.
The diagnostic sequence is always: fix the earliest stage of the attention chain that’s underperforming, then re-measure the downstream metrics before drawing any conclusions about the offer, audience, or budget.
At Prohed, video creative metrics analysis sits alongside CPA, ROAS, and post-click conversion data in every weekly performance review. This connects to our broader work across Performance Marketing, Social Media Marketing, E-commerce Marketing, and App Marketing. Creative performance and campaign performance are the same conversation, not two separate reports.
Conclusion
CTR tells you whether someone clicked. Hook rate tells you whether they stayed past the first three seconds. Hold rate tells you whether the video kept them engaged. Video completion rate tells you whether the creative delivered enough value to hold attention all the way through.
Together, these three creative metrics give Meta video advertisers a complete diagnostic picture of where the attention chain is strong and where it’s breaking. Without them, creative decisions default to instinct. With them, every revision becomes a specific, evidence-based fix to the right problem.
The best advertising platforms reward advertisers who understand their creative at this level of precision. The brands scaling profitably on Meta in 2026 aren’t changing their audiences when video performance drops. They’re reading their hook rate, hold rate, and completion rate first, finding the earliest point of failure, and fixing that before touching anything else.
If your team needs support building a video creative diagnostic process that connects these metrics to actual campaign outcomes, Prohed works with brands as a full-service digital marketing agency in Gurgaon and ad agency in Gurgaon built around exactly this kind of data-led creative strategy. Prohed Gurgaon brings the same analytical rigour to creative diagnosis as to media buying, because in video advertising, the two are completely inseparable.
Frequently Asked Questions
1. What are creative metrics for Meta video ads?
Creative metrics are performance signals that reveal how viewers are experiencing a video ad at each stage of the attention journey. Hook rate, hold rate, and video completion rate are the three most diagnostic for video campaigns, measuring whether viewers stayed at the three-second mark, continued past 15 seconds, and watched the full video respectively.
2. What is hook rate and how is it calculated?
Hook rate is the percentage of impressions where a viewer stayed through the first three seconds of a video. It’s 3-second video views / total impressions * 100. 25% to 30% is a solid baseline on Meta, while 40%+ means the opening is performing well above what Meta campaigns are.
3. What is hold rate and why does it matter?
Hold rate is the percentage of viewers that watched 3 seconds that stayed over 15 seconds, so it’s 15-second video views / 3-second video views * 100. It tells you whether the midsection of a video kept up with what the hook promised, which determines whether or not the offer and CTA get seen.
4. How is video completion rate different from hook rate and hold rate?
Hook rate and hold rate measure early and mid-video attention. Video completion rate measures whether viewers stayed for the full creative, including the benefit explanation, proof points, and CTA. It’s the most useful metric for identifying structural drop-off points in the final third of a video, where CTAs and conversion-driving content typically sit.
5. What does a high hook rate but low hold rate mean for a video ad?
It means that the opening three seconds earned your perspective, but the video failed to deliver on what was implied. The most common reasons are a too slow follow up and pacing after the hook, a transition from a strong visual hook to a more talking-head style, or the benefit explanation coming too late after the hook. The fix is structural, not cosmetic.
6. How do you find the exact drop-off point in a video on Meta?
Meta Ads Manager’s video breakdown report shows a retention curve with viewer drop-off data at each timestamp. This identifies the exact point in the video where viewers are leaving, replacing directional guesses with specific, actionable information about which section needs to be revised.
7. Should these metrics be reviewed at the campaign or ad level?
Always at the individual ad level. Ad sets frequently contain multiple creatives with significantly different hook rate, hold rate, and completion rate profiles. A blended average at the ad set level hides those differences and makes it impossible to identify which specific creative is underperforming and why.
Are your Meta video ads getting impressions but losing viewers before the offer appears? Prohed can run a video creative diagnostic using hook rate, hold rate, and completion rate to identify exactly where the attention chain is breaking
Schedule a Free Strategy Call with PROHED Today