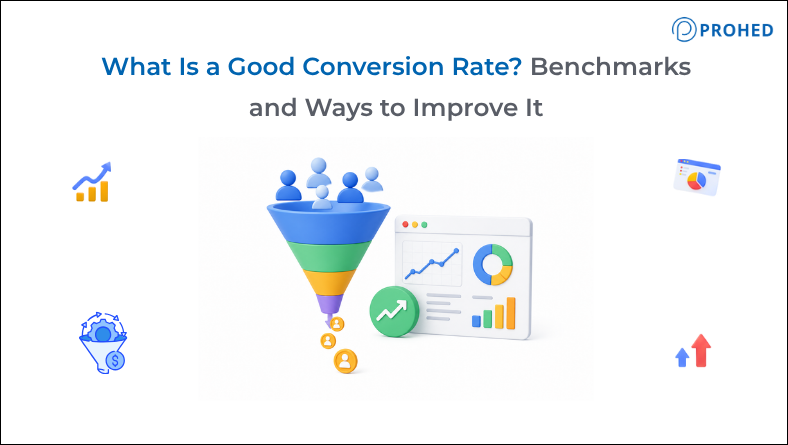
Ask ten marketers what counts as a “good” conversion rate and you’ll get ten different numbers. Most of them won’t apply to your business at all. Here’s the short version: a conversion rate is just the percentage of people visiting your site who actually do the thing you wanted, buy, fill out a form, book a call, whatever your goal is. We track this for nearly every client at PROHED, and one thing we noticed pretty early is that the businesses growing fastest usually aren’t the ones with the most traffic. They’re squeezing more out of the traffic they already have. Let’s talk about what “good” really means here, and more importantly, what you can do if your number isn’t there yet.
So, What Exactly Is a Conversion Rate?
The formula itself isn’t complicated:
Conversion Rate = (Total Conversions ÷ Total Visitors) × 100
Say 10,000 people visited your site last month, and 250 of them bought something. That’s a 2.5% conversion rate. Easy enough.
Where people get confused is that “conversion” means something different depending on who’s asking.For e-commerce, it’s a purchase. For a B2B company, it might be a booked demo. If you run a media site, it could simply be capturing an email address. So before comparing your numbers to some benchmark you found online, be honest with yourself about what a win actually looks like for your business.
What’s Actually a Good Conversion Rate Right Now?
There’s no single number that works for every industry, anyone who tells you otherwise is selling something. But going off what we track across our own client accounts, here’s roughly where things land:
Industry | Average | Good |
Ecommerce (overall) | 2–3% | 4%+ |
D2C fashion & apparel | 1.5–2.5% | 3.5%+ |
FMCG & consumables | 3–4% | 5%+ |
SaaS | 3–5% | 7%+ |
B2B lead gen | 2–4% | 6%+ |
EdTech | 1–3% | 4%+ |
Real estate | 1–2% | 3%+ |
These figures roughly align with WordStream’s 2026 benchmark data, which puts the cross-industry average conversion rate for search advertising at around 8.2%, though that number includes leads, calls, and form fills, not just direct purchases, which is why it reads higher than pure ecommerce numbers. Meta’s average lead generation conversion rate sits closer to 7.7% (WordStream, 2026).
A word of caution here: these ranges shift depending on where your traffic comes from, what device people are using, and even the time of year. Don’t treat this table as gospel. Use it as a rough gut-check.
Website Conversion Rate vs Ecommerce Conversion Rate
People use these two like they’re interchangeable. They aren’t, really.
Your overall website conversion rate covers everything – leads, downloads, newsletter signups, whatever counts as a “goal” in your analytics setup. Your ecommerce conversion rate cares about exactly one thing: did the person buy?
Why does this distinction matter? Because a B2B site can look like it’s converting beautifully purely off PDF downloads, while the sales team is quietly starving for actual leads. Ecommerce brands don’t get to fudge this the same way. At the end of the day, purchases are the number that pays salaries.
Related Read: 7 CRO Fixes That Take a D2C Product Page from 1% to 3%+ Conversion Rate
What’s a Good Conversion Rate for Indian Ecommerce Specifically?
Global benchmarks don’t map cleanly onto India, and treating them as interchangeable is one of the most common mistakes brands make when setting targets. Indian ecommerce runs on a different set of constraints, and the numbers reflect that.
India’s average ecommerce conversion rate sits closer to 1.6%, noticeably lower than the US average of around 2.2% (Statista, via Shopify’s 2026 benchmark data). For D2C brands specifically, a realistic “good” range is 1.5% to 2.5%, with well-optimised Shopify stores in India pushing toward 3% to 4%.
A few factors explain the gap:
- COD dependency: Cash on delivery still accounts for a meaningful share of Indian orders, though it’s been declining as UPI adoption grows. Every COD order carries more hesitation at checkout than a prepaid one, which shows up directly in conversion numbers.
- Mobile-first traffic: The vast majority of Indian ecommerce traffic comes from smartphones, and mobile conversion rates typically run well below desktop, even globally. In India, this gap tends to be wider because of checkout friction on smaller screens.
- Festive season swings: Conversion rates during Diwali, Republic Day sales, and similar periods can run significantly higher than baseline months, so comparing a random Tuesday in July to your festive-season numbers isn’t a fair benchmark.
- Tier 1 vs Tier 2/3 city behaviour: Metro shoppers with established digital payment habits tend to convert faster than Tier 2 and Tier 3 audiences, who are often still building trust in online payments and return policies.
If you’re an Indian D2C brand benchmarking yourself against a global “3% is average” figure, you’re likely comparing yourself to the wrong number. Benchmark against Indian data first, then your own category.
Why Your Numbers Might Be Stuck
Before you start changing things, it helps to know where sites usually leak visitors. In our experience it’s rarely one dramatic problem, it’s a few small ones stacked together.
- Slow Page Load Times: A delay of even one second causes mobile users on patchy connections to drop off before the page loads.
- Unclear Value Proposition: Visitors leave within five seconds if they cannot instantly tell what you sell or why it is worth their time.
- High-Friction Forms: Unnecessary form fields create friction, giving users a reason to close the tab.
- Poor Mobile Optimization: Treating mobile design as an afterthought alienates the vast majority of Indian web traffic coming from smartphones.
- Lack of Trust Signals: Missing customer reviews, hidden return policies, or a lack of clear business identification trigger hesitation at checkout.
- Ad-to-Landing-Page Mismatch: Disconnects between ad promises (like a discount) and landing page messaging kill conversion rates faster than almost any other issue.
So What Do You Actually Do About It?
This is conversion rate optimisation, and I’ll say the unglamorous part up front, you don’t fix a site once and move on. It’s ongoing. You test, you look at the results, you adjust, you test again.
- Audit Drop-off Points: Review Google Analytics 4 and install a basic heatmap tool to pinpoint where users drop off, rather than guessing what needs fixing.
- Optimize Site Speed: Compress images, eliminate unnecessary scripts, and upgrade cheap hosting to boost speed, often delivering bigger conversion lifts than a full redesign.
- Reduce Form Friction: Strip out non-essential form fields and offer guest checkout on e-commerce sites to prevent cart abandonment.
- Clarify the Headline: Write a direct headline that immediately tells visitors why your offer matters, skipping clever or vague messaging.
- Position Social Proof Strategically: Place reviews, ratings, and trust signals right next to key action steps (like the “Add to Cart” button) rather than burying them on isolated pages.
- Test Variables Systematically: Change only one element at a time during testing to isolate what actually drove the performance change.
- Align Ad Copy with Landing Pages: Ensure every Meta and Google ad offer matches the landing page headline and promotion verbatim to eliminate disconnects.
- Verify Mobile UX First-Hand: Manually test the entire conversion and checkout flow on an actual smartphone to fix broken layouts, tight tap targets, and spacing issues.
How Conversion Rates Differ Across Channels
Not all traffic converts the same way, and treating one blended conversion rate as the only number that matters can hide where the real opportunity is.
| Channel | Typical Behaviour |
|---|---|
| Organic search (SEO) | Converts higher than most paid channels since visitors arrive with existing intent, but takes months to build |
| Google Ads (search) | Strong intent-matching, generally the highest-converting paid channel for active buyers |
| Meta Ads (cold traffic) | Lower conversion, better suited for awareness and retargeting than immediate purchase |
| Meta Ads (retargeting) | Converts noticeably better than cold traffic since the audience already knows the brand |
| Email/existing customers | Typically the highest-converting channel of all, since trust is already established |
This is why comparing a Meta cold-traffic campaign’s conversion rate directly to your email list’s conversion rate isn’t a fair fight. Diagnose channel by channel before deciding what “underperforming” actually means for your business.
How PROHED Approaches Conversion Rate Optimization
We don’t treat CRO as some bolt-on service we sell separately. It’s baked into how we run performance marketing for our D2C, FMCG, EdTech, and B2B clients from day one.
In practice, that usually looks like:
- Running funnel audits to spot exactly where drop-off is happening
- Testing landing pages alongside live Google Ads and Meta Ads campaigns, not after the fact
- Making UX recommendations based on real user behaviour, not assumptions
- Pairing SEO and CRO together, since organic visitors often behave very differently than paid ones
- Keeping A/B tests running continuously rather than doing one redesign and calling it done
As a performance marketing agency in Gurgaon working across pretty different categories, we’ve seen conversion benchmarks vary wildly from one client to the next. But one thing stays consistent: small, steady improvements almost always beat waiting for one perfect redesign.
Bottom Line
There’s no universal “good” conversion rate, it depends on your industry, your traffic, your market, and what you’re actually trying to get people to do. For Indian brands specifically, benchmark against Indian data first; global averages will make your numbers look worse than they actually are. The fundamentals of improving it barely change though: remove friction, build trust, and make sure every step of the journey, from the ad someone clicks to the checkout page they land on, tells the same consistent story. Treat conversion rate optimization as something you keep doing, not something you finish, and the results tend to show up where it counts, in revenue, not just a dashboard.
FAQs
1. What’s a good ecommerce conversion rate in India?
Most Indian ecommerce sites land somewhere around 2–3%. Cross 4% and you’re already ahead of most competitors.
2. How often should I check my conversion rate?
Monthly, at least. During sales pushes or big campaigns, check weekly so problems get caught before they get expensive.
3. Does traffic source really change conversion rate that much?
Yes, quite a bit. Organic and direct visitors usually convert better than cold paid traffic, they already have some trust built up before they even land.
4. What conversion rate should I expect from Google Ads?
Somewhere around 3–5% is generally considered solid, though it depends heavily on your industry and how tightly your keywords are targeted.
5. Could a really high conversion rate be a red flag?
Sometimes. A sudden unexplained spike is worth checking for tracking bugs or bot traffic before you celebrate too early.
6. How long before CRO work shows real results?
Usually 4–8 weeks, depending on traffic volume and how many changes are being tested at once. Don’t judge it after a few days.
7. Does traffic volume matter less than conversion rate?
For revenue, often yes. A smaller audience that converts well can outperform a much bigger one that doesn’t, especially with a limited ad budget.
8. What tools do I actually need to track this properly?
Google Analytics 4 and Google Tag Manager cover most of it. If you’re running paid campaigns, Meta Ads Manager helps cross-check conversion data on that side too.
Curious how your website stacks up against industry benchmarks? Reach out to PROHED, a performance marketing agency in Gurgaon, for a free conversion audit built around your business, not a generic template.
Schedule a Free Strategy Call with PROHED Today